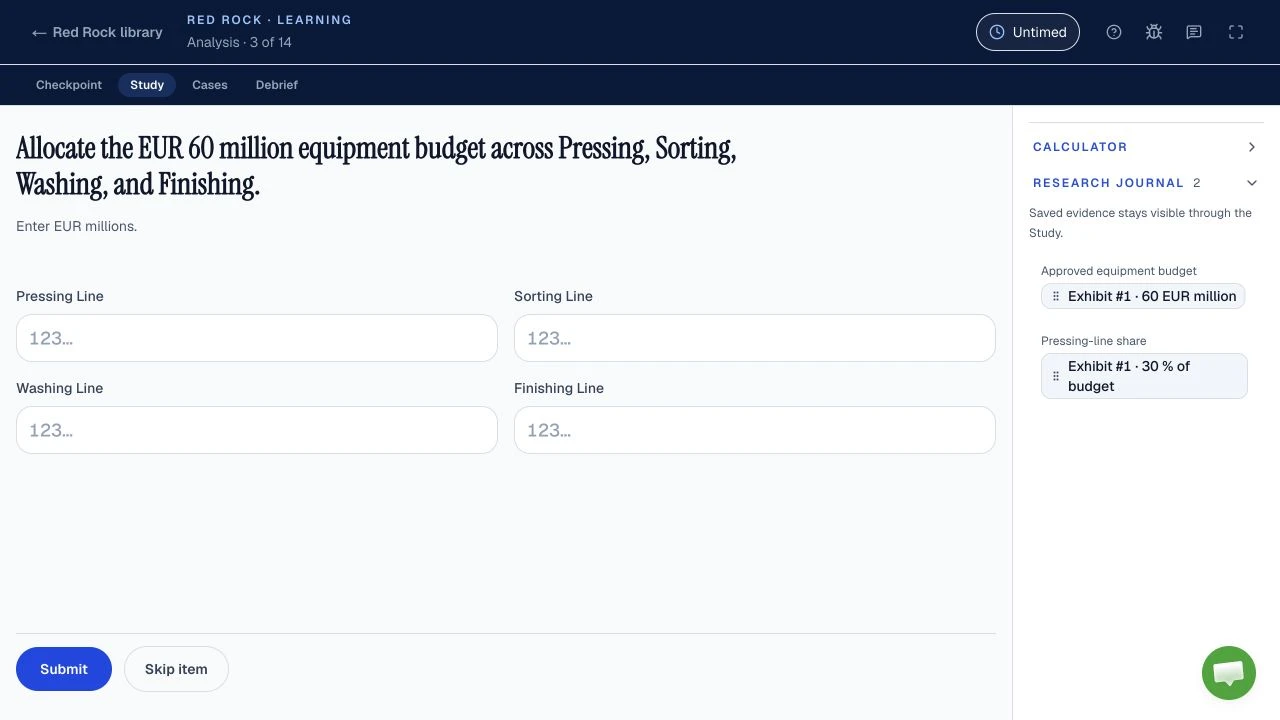
Independent practice, not assessment content. The fictional restoration study below was written for this guide. It is a short teaching exercise, not a full official-format simulation. No question, answer or score comes from McKinsey.
What is Red Rock practice preparing you to do?
McKinsey's public Solve page describes a gamified problem-solving assessment but does not publish a Red Rock blueprint. Current preparation providers describe Red Rock as a connected data study: identify relevant information, preserve it for later questions, calculate from it, and communicate a conclusion with an appropriate table or chart. They commonly describe study stages such as investigation, analysis and report, plus additional shorter cases. Treat those names and sequences as third-party reports, not a promise about your sitting.
The reported research journal matters because later work may depend on evidence selected earlier. A useful preparation habit is therefore to save a number with its label, unit, period and denominator, rather than copying an isolated value. Providers also describe an on-screen calculator, but calculator fluency cannot rescue the wrong inputs or formula. Your invitation and the live tutorial remain authoritative for the tools, order and time available to you.
The durable Red Rock skills
- Evidence selection: match each saved fact to the question it can answer and ignore attractive background data.
- Percentage reasoning: distinguish relative growth, percentage-point change and a share of a total.
- Pooled and weighted quantities: combine counts or apply the correct weights instead of averaging rates blindly.
- Chart judgment: choose a visual that preserves the relationship in the data, then state what it shows without inventing causation.
Preparation sites publish different clocks and question counts, and McKinsey's current public FAQ says only that the total length is stated in each candidate's invitation. This guide does not turn a reported version into a universal timing rule. The connected exercise below focuses on the reasoning that survives a changed interface.
How does this Red Rock practice workbook diagnose mistakes?
Each question isolates one reasoning error: selecting irrelevant evidence, using the wrong denominator, averaging rates that should be pooled, or choosing a chart that changes the meaning of the data. Work the question before opening its explanation, then name the error rather than only recording the correct answer.
The brief: did a wetland restoration program improve?
A research team manages two non-overlapping wetland zones, North and South. It wants to report how much restored area increased between Year 1 and Year 2 and what proportion of Year 2 water samples passed its local quality test. The sampling program is separate from the area measurement: a hectare is not a water sample.
The total site contains 500 hectares. A weather station recorded 12 rainy days in Year 2. Those are background facts, not automatically inputs to every calculation. The following table contains all the data needed for the four questions.
Scroll the table horizontally on a small screen. Area is measured in hectares; sample counts are individual tests.
| Zone | Restored area, Year 1 (ha) | Restored area, Year 2 (ha) | Year 2 samples passed | Year 2 samples tested |
|---|---|---|---|---|
| North | 80 | 100 | 18 | 20 |
| South | 120 | 132 | 48 | 80 |
Question 1: which evidence answers the growth question?
The team asks: “By what percentage did the combined restored area grow from Year 1 to Year 2?” Choose the required evidence before doing arithmetic:
- The two restored-area columns for both zones.
- The Year 2 sample-pass counts.
- The total site area of 500 hectares.
- The number of rainy days.
Reveal the evidence selection and why the other facts do not help
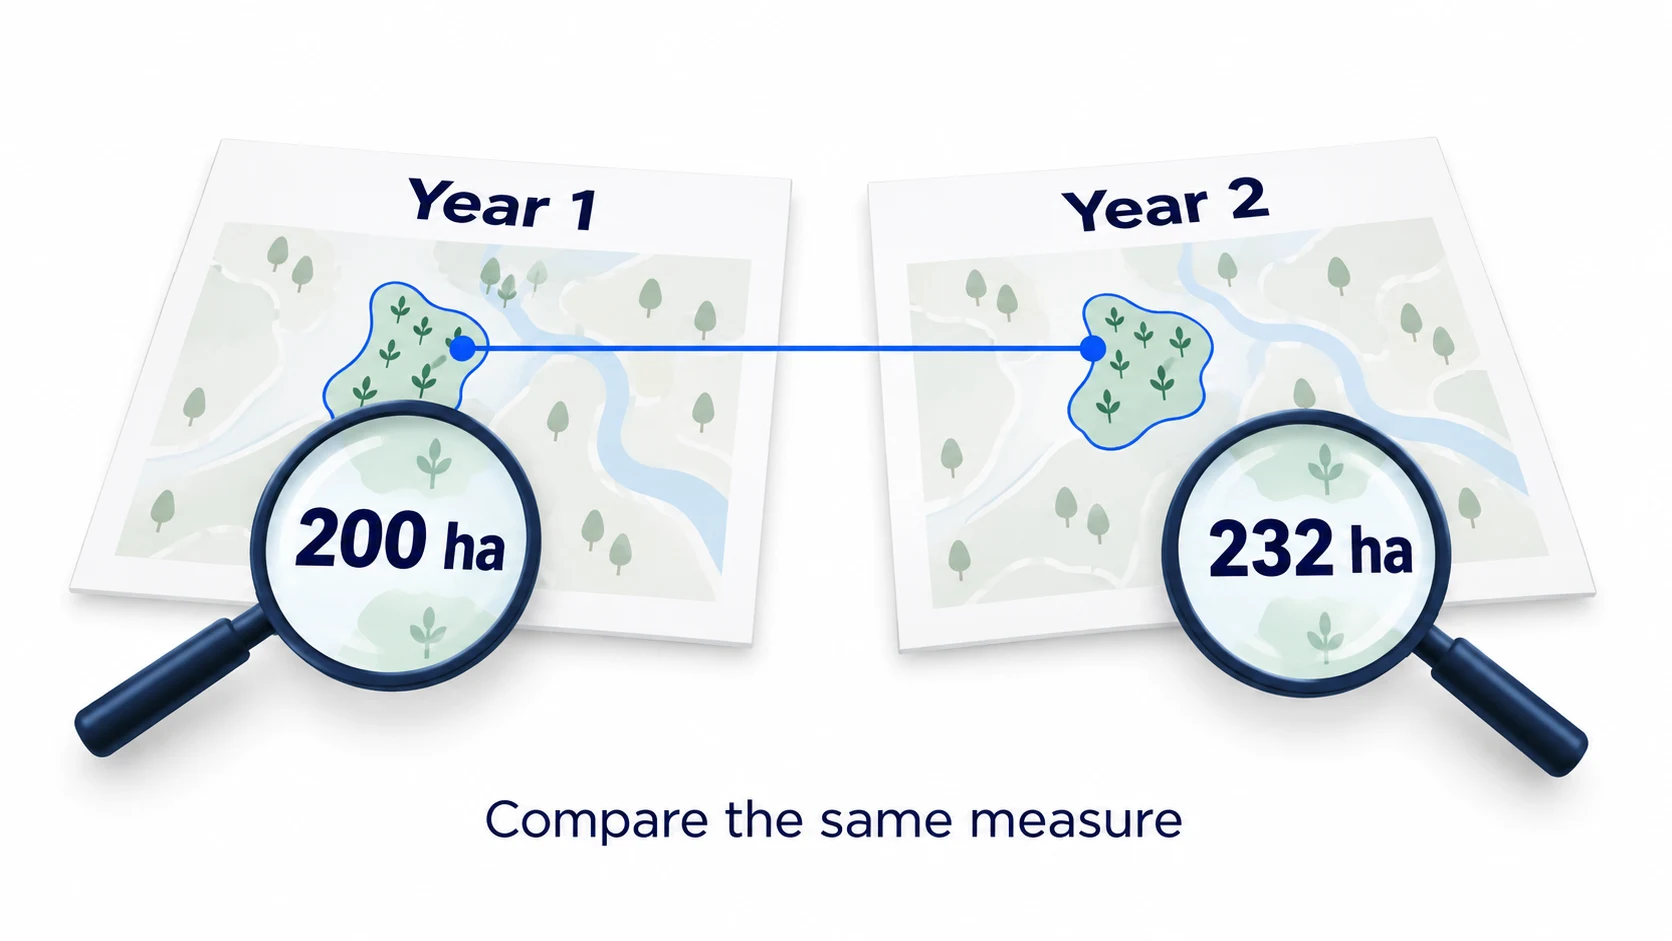
Choose item 1. You need a comparable starting total and ending total for restored area. Year 1 totals 200 ha; Year 2 totals 232 ha.
Sample passes measure a different outcome. Total site area would help if the question asked what share of the whole site is restored, but it is not the denominator for growth in restored area. Rainfall may matter for a separate causal investigation, yet these observations alone cannot establish why area changed.
A useful practice note would be “combined restored area: Year 1, 200 ha; Year 2, 232 ha.” Saving numbers without labels risks substituting the wrong unit later.
Question 2: pooled growth, not the average of growth rates
Calculate combined growth and each zone's growth. Use (new value minus old value) divided by old value, then multiply by 100. Should you average the two zone percentages to obtain the combined answer?
Reveal the growth calculation and the tempting wrong answer
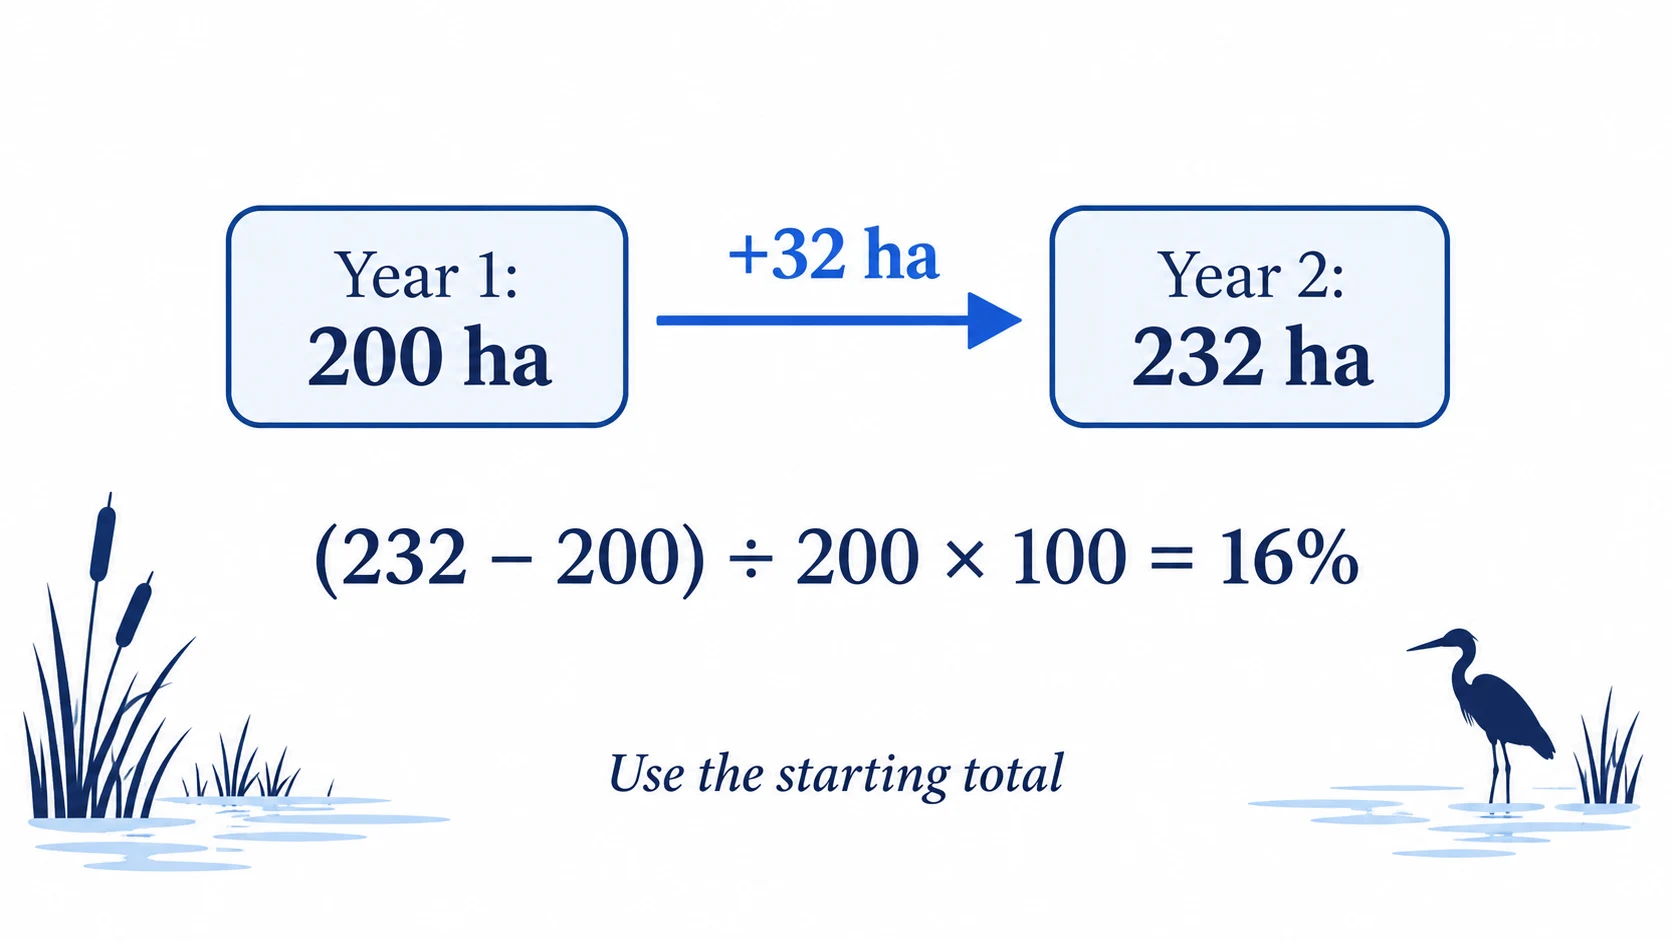
Combined growth is (232 − 200) / 200 × 100 = 16%. North grows from 80 to 100 ha, or 25%. South grows from 120 to 132 ha, or 10%.
The simple average, (25% + 10%)/2 = 17.5%, is wrong for the combined area. It gives the smaller North starting area the same weight as South. Weighting by starting hectares gives 25% × (80/200) + 10% × (120/200) = 16%.
Another wrong answer is 13.79%, obtained by dividing the 32 ha increase by the ending total of 232 ha. Growth from Year 1 uses the starting total, 200 ha, as its denominator.
Separate relative growth from percentage-point change
Now suppose a separate monitoring indicator rose from 40% to 50%. Did it rise by 10%, by 10 percentage points, or by 25%?
Reveal the percentage and percentage-point distinction
The absolute difference is 50% − 40% = 10 percentage points. Relative growth is (50 − 40)/40 × 100 = 25%. Both statements can describe the change, but they answer different questions. “It rose by 10%” is not an interchangeable way to say “10 percentage points.”
Label the result with its unit. The wetland question asks for relative area growth, so its answer is 16%, not 16 percentage points.
Question 3: calculate the overall sample-pass rate
What percentage of all Year 2 samples passed? North passed 18 of 20 and South passed 48 of 80. Try it before opening the answer. Should each zone's percentage receive equal weight?
Reveal the weighted pass rate and diagnose the 75% mistake
Combine counts before dividing: (18 + 48)/(20 + 80) × 100 = 66%. There are 66 passes among 100 samples.
North's rate is 90%; South's is 60%. Averaging them gives 75%, but South supplied four times as many samples. The weighted calculation is 90% × 0.2 + 60% × 0.8 = 66%.
Do not weight these sample rates by restored hectares. The denominator is samples tested, not land area. Also, the observed sample rate alone does not prove the same proportion of every water source passes; that inference would require evidence about the sampling design.
A denominator decision map for this dataset
The same table supports several valid calculations. The wording of the question determines which denominator belongs in the answer.
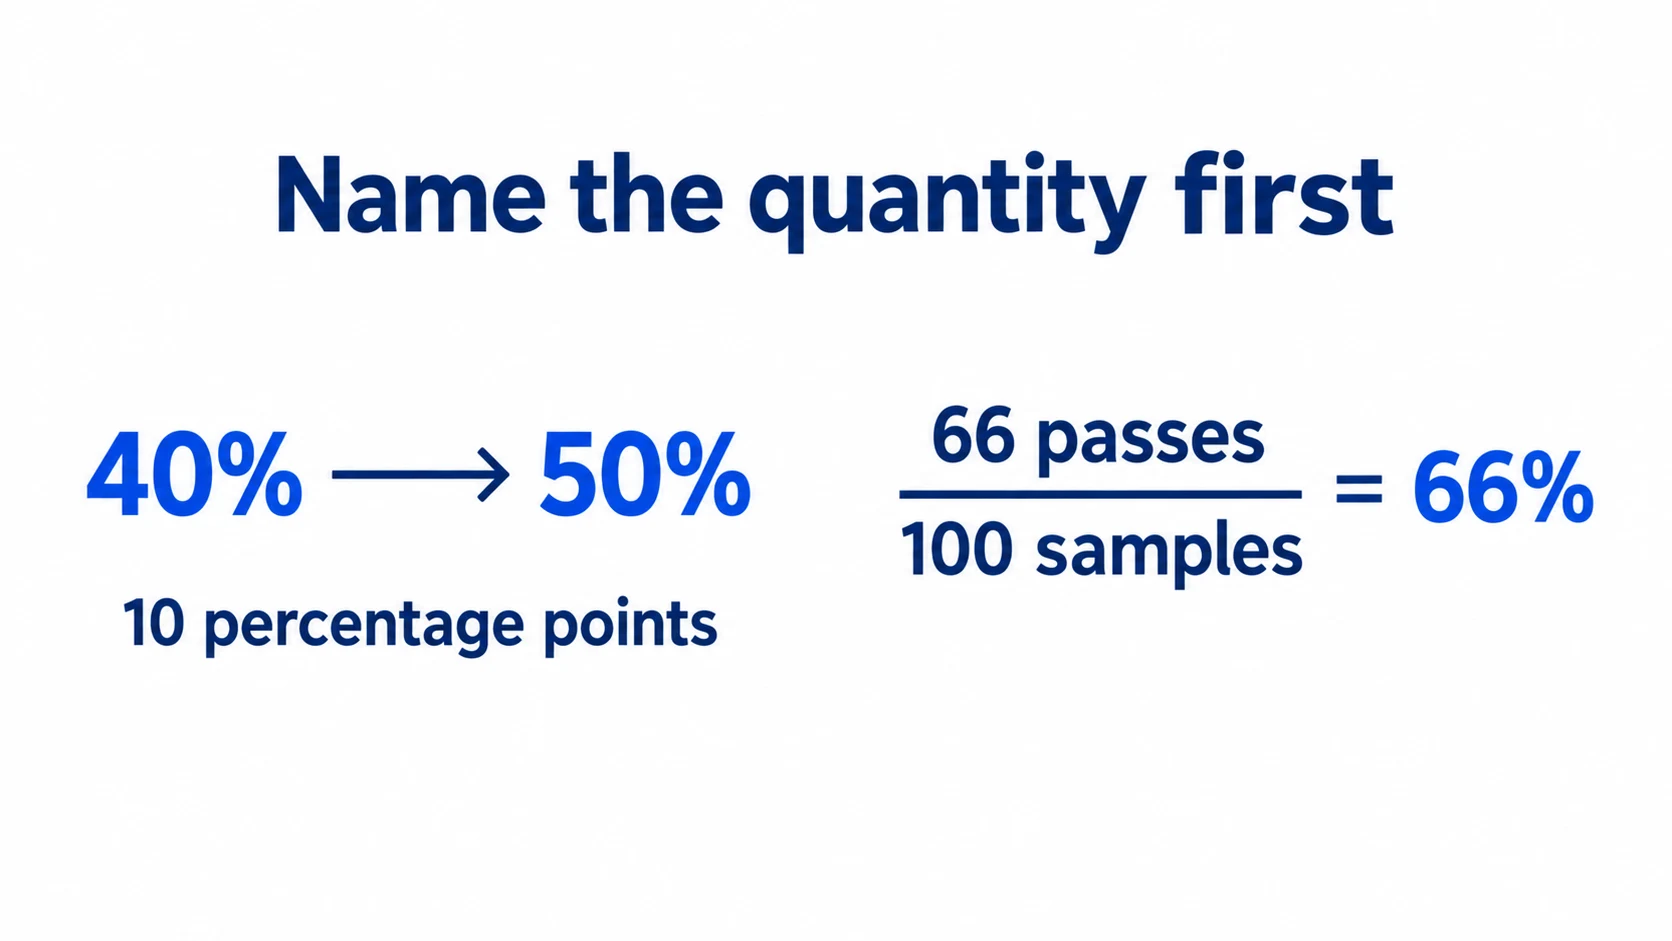
Keep the readable math in your notes: 50% minus 40% is 10 percentage points, while 66 passes divided by 100 tests is 66%. The picture is a reminder of the distinction, not a substitute for writing the numerator, denominator and unit.
Question 4: choose a chart that matches the report
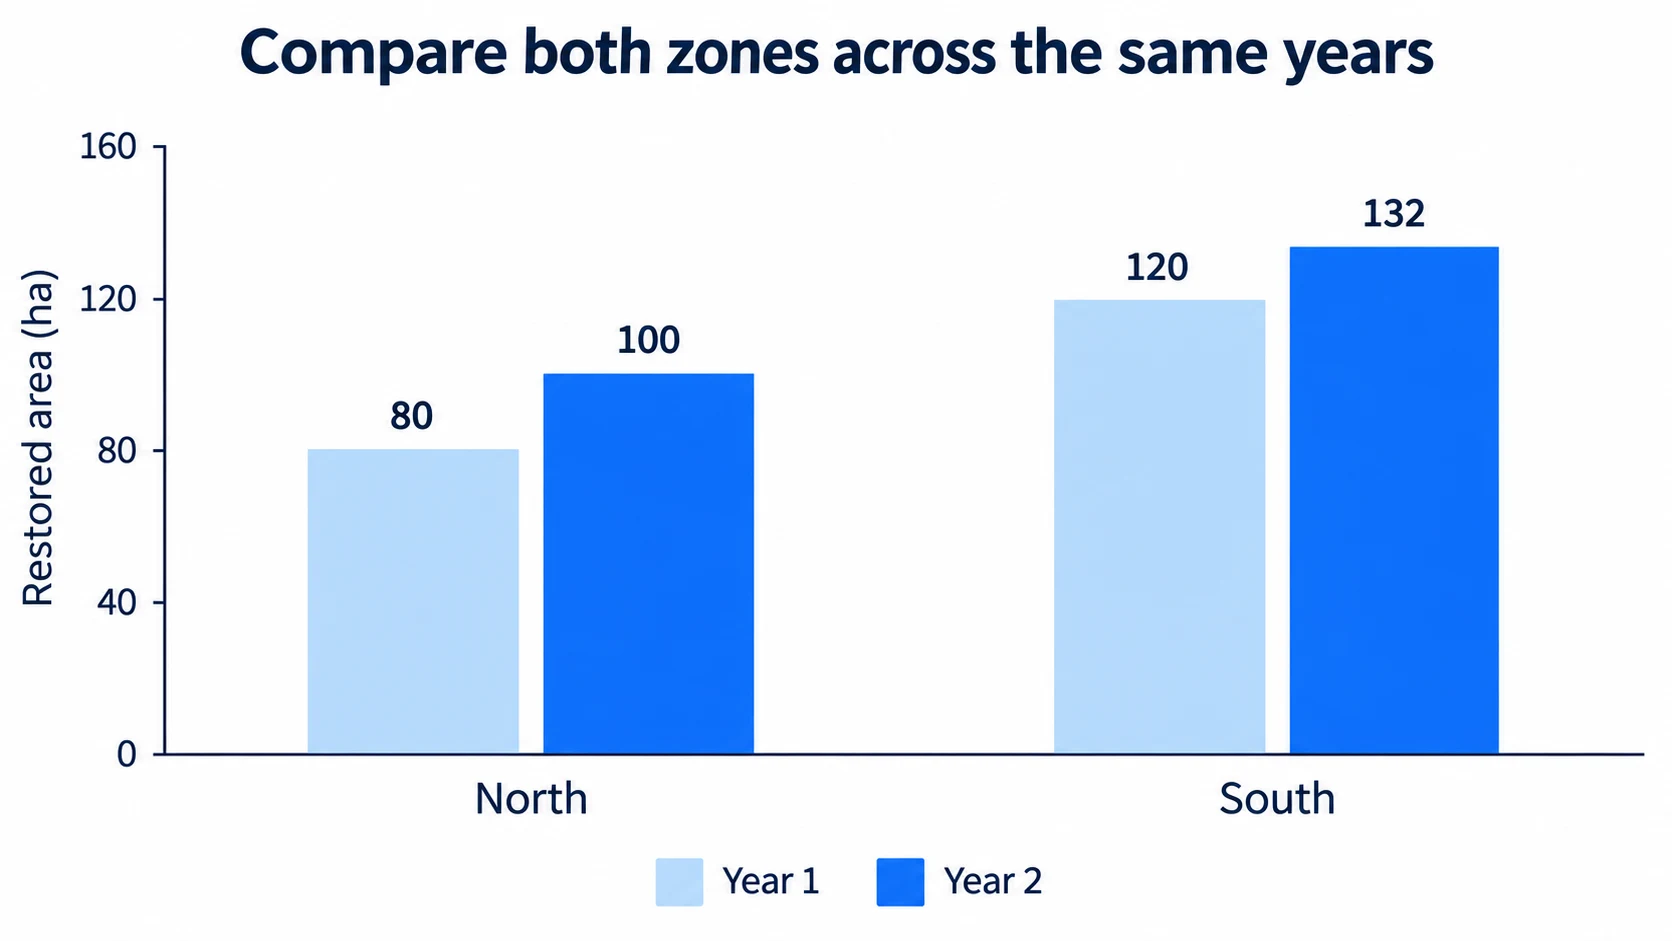
The report asks readers to compare each zone's restored area in Year 1 and Year 2. Which is the clearest choice: a grouped bar chart, a pie chart of all four measurements, or a line chart labeled “daily restoration”?
Reveal the chart choice and a complete report sentence
A grouped bar chart is a clear choice: one group for North, one for South, with a Year 1 and Year 2 bar in each group. Label the vertical axis “Restored area (ha)” and start the bar axis at zero. Use the values 80, 100, 120 and 132 directly.
The four measurements are not mutually exclusive pieces of one whole: each zone appears at two points in time. A pie chart would misrepresent that relationship. A chart labeled “daily” invents a time resolution the dataset does not provide. A two-point slope chart could also work if its years and units are clearly labeled; our choice is not a universal rule against line charts.
Example report: Combined restored area rose from 200 to 232 ha, a 16% increase. North grew faster in percentage terms, while South retained the larger restored area. Separately, 66% of Year 2 samples passed the quality test. The data do not establish that restoration caused the pass rate.
A repeatable practice routine
- Restate the question. Name the quantity, period, comparison and requested unit.
- Select only relevant evidence. Keep labels and denominators beside values.
- Write the formula before substituting. A correct arithmetic operation on the wrong denominator remains a wrong answer.
- Check magnitude and units. A 32 ha increase on 200 ha should be more than 10% and less than 20%.
- Explain the result. Separate observation from an unsupported causal conclusion.
These are preparation habits, not claims about hidden process scoring or how often you must click a journal. For the broader assessment journey, use the invitation guide. For a different original exercise, try Sea Wolf combinations.
Sources and scope
McKinsey's official assessment page and current linked FAQ were checked September 20, 2026. McKinsey says no preparation is required. Our optional exercises teach transferable reasoning and do not predict hiring outcomes.
The competitor benchmark included PSG Secrets' Redrock guide and MConsultingPrep's Redrock deep dive. Their format descriptions and scoring theories are third-party material, not an official specification. This article uses a new wetland dataset rather than copying their examples or Road to Offer's broader Red Rock guide.